产品
FIB-SEM
Nanomanipulators
OmniProbeOmniProbe Cryo软件
AZtec3DAZtecFeatureAZtec LayerProbeTEM
Hardware
EDSUltim MaxXploreImaging
软件
AZtecTEM
 牛津仪器集团成员

21st October 2020 | Author: Dr Haithem Mansour
Nanoparticles are a key ingredient in many industrialized products such as paints, plastics, metals, cosmetics and even food. Characterizing the key parameters of nanoparticles (size, shape, concentration, porosity…etc) is essential to understand their behaviour, performance, and risk to the environment and human health. In addition, their presence needs to be controlled and well labelled on products.
One of the most used techniques to characterize nanoparticles is scanning electron microscopy (SEM) with Energy Dispersive Spectrometry (EDS). Due to their size (1- 100nm), they cannot be seen using optical microscopes hence the need for such techniques. High resolution imaging in SEM allows the imaging of the particles, and EDS gives elemental and chemical information about the nanoparticles.
The size of nanoparticles and their low emission of X-rays make their analysis challenging. Many aspects need to be considered to have a successful analysis:
Sample preparation is a crucial step that will determine if the analysis will be possible and will have an impact on the quality and accuracy of the results as well. It consists of several essential steps to extract the nanoparticles from the material, to clean them from any potential residues and to avoid particle aggregation [1].
Detecting nanoparticles (<100nm) with EDS requires working at low accelerating voltages (<5kV) to achieve high spatial resolution. It also requires working at short working distance (WD<6mm) for the best results. These two aspects are not typical for conventional EDS technique and will require a very sensitive detector working at low WD. The windowless Ultim Extreme EDS detector is used in my example below and is dedicated to low voltage analysis and well suited for nanoparticles.
Working at low kV adds the challenge of a limited range of X-ray lines excited. This means that low energy lines such as M and even N lines must be used to identify heavy elements. In addition, overlaps between x-ray peaks will be more frequent in such limited energy ranges. AZtecLive software algorithms (Tru-Q® technology) detect low energy lines and ensure accurate results by correcting peak overlaps and eventual spectrum defects (TruMap).
Analysing nanoparticles will require scanning the same area at very high magnification (>50k X) for several minutes and depending on the stability of the SEM (temperature, cooling, vibrations, contamination…etc) the scanned area could shift during the analysis. Correcting this shift is crucial to achieve a good result at the end of analysis. To overcome this issue, the AZtecLive software provides very effective drift correction routines (AutoLockTM) which are essential when working at the nanometre scale.
In this blog, I am sharing an analysis of titanium dioxide and zinc oxide nanoparticles. These particles are widely used in sun creams for their ability to block UV radiation while remaining transparent on the skin.
In addition, TiO2 nanoparticles have been widely used as a food additive for its colorant (white pigment) and opacifying properties (ice cream, candy, sweets…etc). It is more commonly known in Europe as E171. Lately there is a growing concern about TiO2 risks to human health in France where their use was suspended early this year (January 2020) from food products for precautionary reasons. Research [1][2] has shown that these nanoparticles can travel inside the body from bowel to blood and then accumulate in different organs like the liver and spleen. Chronic exposure to these nanoparticles can initiate colorectal carcinogenesis. Furthermore, a recent study has shown that for pregnant women these nanoparticles can go through the placenta and reach the foetus.
It is important that companies label products containing nanoparticles to make consumers aware of their existence. This is where laboratories like the French Institute of Metrology (LNE) has an important role to analyse and help labelling these products.
This data was collected in collaboration with the LNE Nanotech Institute where the samples were extracted from sun cream, then prepared and analysed. The analysis was completed using the Ultim Extreme windowless EDS detector at an acceleration voltage of 3kV and a working distance of 5mm.
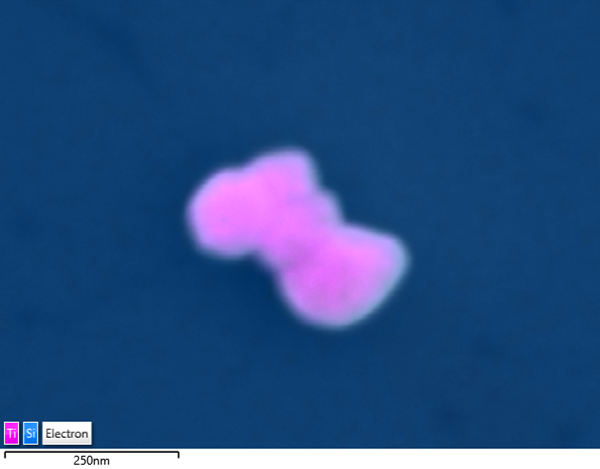
Fig.1 EDS map of few TiO2 nanoparticles agglomerated on a Si substrate (food sample) – analysed at 5kV, 120k X magnification

Fig.2 EDS map of TiO2 and ZnO nanoparticles from a sun cream sample – collected at 3kV at 20k X magnification
This EDS map shows an agglomeration of ZnO (red) and TiO2 (green) nanoparticles. These particles (<100nm) are spatially well separated thanks to the high sensitivity of the Extreme detector at low kV (3kV). This map was collected for 12 min using the “Autolock” drift correction routine.
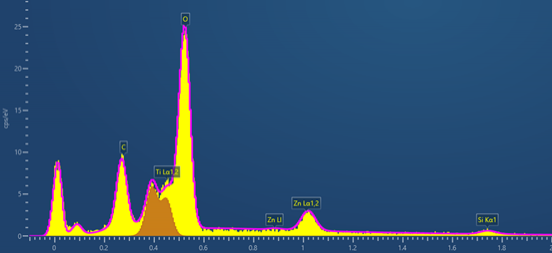
Fig.3 EDS spectrum collected from a TiO2 nanoparticle at 3kV
This is the EDS spectrum collected at 3kV from a TiO2 particle. It clearly shows the high energy resolution obtained with Extreme detector, the Ti L1,2 lines (452eV) are used in the EDS map above.
It is important to say that 6 years ago such analysis was not possible. Such performance is obtained thanks to the latest hardware and software development in the EDS technique and to the improvement in high-resolution SEM performance at low kV. It is still not widely known that low kV EDS analysis is possible and with such high quality.
From sun cream to ice cream, it is important to understand exactly what is in the products we use and consume. Hopefully, this blog has given you a small insight into the insights that EDS, as a characterisation tool, can provide when studying nanoparticles.
Find out more
Dr Haithem Mansour
X-ray Product Manager
This work was done with the LNE Nanotech Intitute NanoMetrology Group
Contributors:
Mouna Oulalite, Sebastien Ducourtieux, Alexandra Devallée et Loïc Crouzier
References:
[1] N. B. Ghomrasni et al. , Powder Technology, Volume 359, 2020
[2] S. Bettini et al. , Scientific Reports, Article number 40373, 2017
[3] A. Guillard et al. , Particle and Fibre Toxicology, Article number 51, 2020
[4] C. Coméra et al. , Particle and Fibre Toxicology, Article number 26, 2020
We send out monthly newsletters keeping you up to date with our latest developments such as webinars, new application notes and product updates.

© 牛津仪器 2026
 公安机关备案号31010402003473