产品
FIB-SEM
Nanomanipulators
OmniProbeOmniProbe Cryo软件
AZtec3DAZtecFeatureAZtec LayerProbeTEM
Hardware
EDSUltim MaxXploreImaging
软件
AZtecTEM
 牛津仪器集团成员

22nd November 2019 | Author: Dr Matt Hiscock
Geological materials hold a huge wealth of information in their grains. Grain size, composition, the relationships between grains and much more is of great value in understanding how to extract valuable resources, in understanding geological history and in understanding engineering properties.
In order to gain the fullest possible understanding of a rock, it is often necessary to gather information from hundreds, if not thousands of grains to build an accurate statistical picture of the relative proportions of the different minerals that are present within it and how they relate to one another. This is equally true if you’re looking at a polished section of a rock from a research point of view or looking at a particle mount to work out how to optimise a minerals processing plant.
Traditionally analysing rocks like this meant spending a large amount of time on them with an optical microscope – and having spent time working as a geologist myself, I know this can be laborious work. Thankfully, over the last few decades, geologists have been able to make use of automated scanning electron microscopy which can expedite this analysis and provide more information than we could gather with optical analysis.
Automated mineralogy is a dedicated form of SEM based particle analysis which is optimised for the analysis of geological materials. AZtecMineral is our brand new, powerful, automated mineralogy system and is part of the AZtec NanoAnalysis suite. By combining automatic image acquisition and processing with automated energy dispersive x-ray spectroscopy (EDS) spectrum acquisition, AZtecMineral measures the morphologies and compositions of tens of thousands of grains per hour and provides dedicated reports containing mineralogical information that wouldn’t otherwise be available.
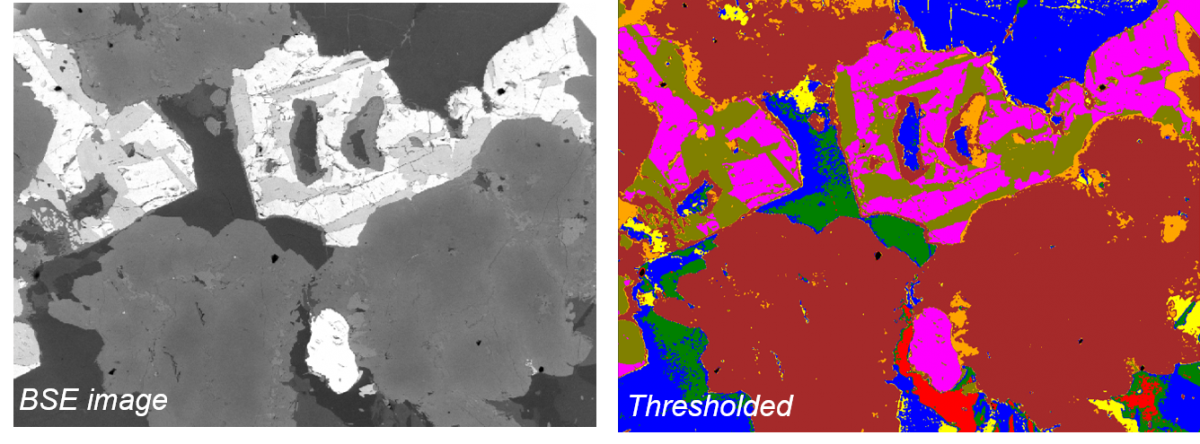
The system works by first acquiring a backscattered electron (BSE) image which we use to identify where one grain starts and the next one ends. This is done using a series of grey level thresholds that divide the image up into the different areas that we will acquire EDS data from. This is a really efficient approach as it means that we can work quickly by only acquiring one spectrum from each grain (maybe 200 – 500 per field of view) rather than getting one per pixel as we would in a mapping type approach (>750,000 per field of view in the example below). We can even decide to treat each threshold differently – perhaps deciding to obtain only morphological data from phases we are not particularly interested in and compositional EDS data from those that we are focussed on.
Once set up, the analysis proceeds automatically across samples of any size – as long as they are flat and can fit into the SEM! Each grain can be classified live during the acquisition using classification schemes that you can develop using the same advanced functionality as AZtecFeature or, alternatively, auto-classified against a mineral database.
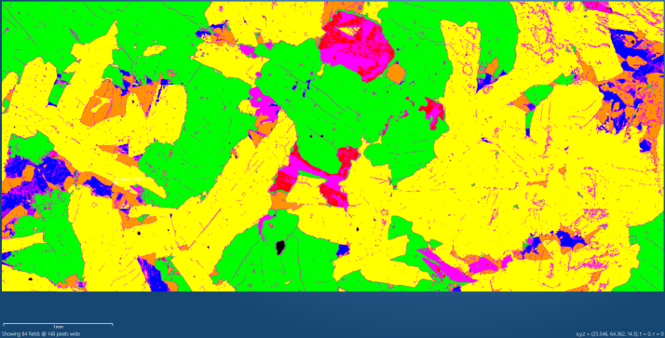
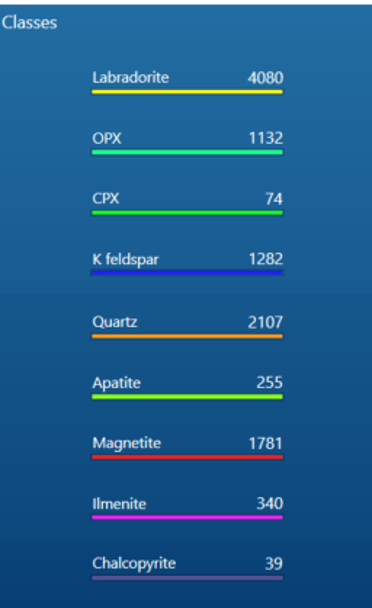
Below is an example of this in action – you can see a large area – just over 20mm2 that has been classified according to the key that you can see on the right.
This all happens really quickly as AZtecMineral takes advantage of the speed and accuracy of our Ultim Max silicon drift detectors (SDDs). It also takes advantage of our TruQ algorithms which ensure that even when you’re working at the high count rates that we normally use for this application, you can trust the results that the system gives you – even to for the analysis of unknown samples.
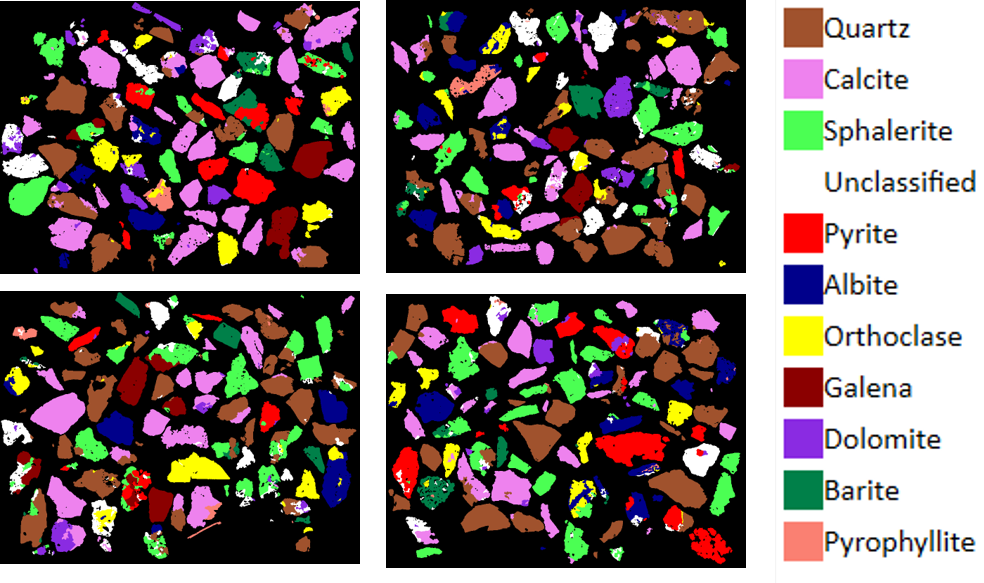
Once the run is finished, it’s a matter of just a few clicks to get your mineralogical report which includes information such as common perimeter associations, phase abundances, grain size distributions and elemental deportment as well as liberation and particle association data if you’re working with particulated samples such as from a minerals processing plant – where the aim is to optimise the processing to extract the desired mineral at an acceptable level of purity whilst minimising cost and resource use. The image below show’s an example of some data acquired from such a sample – we’ll discuss liberation analysis in more detail in a future blog.
So, I hope you can see how AZtecMineral is a really powerful addition to the AZtec platform for investigating rocks. It’s equally applicable for solid rock and particulated samples and, as it is part of AZtec, you can maintain the flexibility of your microscope, use all of the other EDS techniques (large area mapping, linescanning, Point and ID etc.) and work with other techniques like EBSD and WDS as and when you need to.
Discover more about AZtecMineral now, and don’t forget to subscribe to the blog to be the first to know when new articles are released.
We send out monthly newsletters keeping you up to date with our latest developments such as webinars, new application notes and product updates.

© 牛津仪器 2026
 公安机关备案号31010402003473