产品
FIB-SEM
Nanomanipulators
OmniProbeOmniProbe Cryo软件
AZtec3DAZtecFeatureAZtec LayerProbeTEM
Hardware
EDSUltim MaxXploreImaging
软件
AZtecTEM
 牛津仪器集团成员

21st April 2021 | Author: Kim Larsen
Despite the ongoing pandemic creating barriers for scientists and researchers, new chemistries and solutions are being developed at a pace never seen before to support the global demand for electric vehicles and battery driven appliances. In recent months Tesla and VW have announced their roadmaps in relation to battery technology used in future EVs, adding pressure to develop better products using state of the art technology.
Part of my role at Oxford Instruments relates to looking at how our products are being used within the battery market. This area is developing at a rate so fast that new problems are constantly being identified. One example of this is our recent research into how raw powders can be analysed in order to ensure that there are no contaminants.
However, another issue is to determine and control the chemistry of the powders used for cathode production. By using AZtecFeature, we can automate the data acquisition from each powder particle and the chemical data for each particle can then be plotted on a ternary diagram. This shows the variation in data points as well as the overall chemistry of the powder, an easy way to check the quality.
In this example, we look at NCM powder in the SEM. The location of each particle is identified based on the backscatter image. A spectrum is automatically acquired from the centre of each particle and the results automatically plotted, as shown in the video below. On the ternary diagram, it is easy to see that the powder chemistry is NCM 523 and that there are relatively few outliers in terms of data points.
The powder materials are mixed during the production of cathode material for battery production; however we can still do analysis in the SEM. Typically this would be done by creating cross section samples using either ion milling or FIB-SEM (focussed ion beam) to prepare an area for analysis. This makes it possible to monitor the changes in chemistry all the way from the initial powder to the final products, while being able to compare the chemical variations in the material with the performance of the final product.
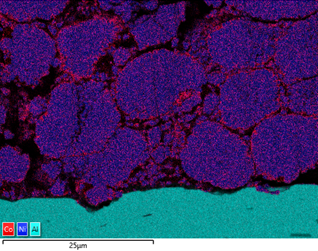
The figure below shows the variation in Co content around the Ni rich particles in a cathode foil cross section. From the data, it is evident that there are local variations in chemistry, potentially due to how the material has been processed. Similar analysis can be done of anode material, looking at the silicon enriched spherical graphite particles.
Current developments are taking us towards solid state battery technology, which should make it even easier to use an SEM or SEM-FIB for analysis. I am very much looking forward to seeing where the development takes us and how the use of characterisation tools can help the development.
We send out monthly newsletters keeping you up to date with our latest developments such as webinars, new application notes and product updates.

© 牛津仪器 2026
 公安机关备案号31010402003473